Keplerian Orbital Elements
The set of six independant constants which define an orbit are called the Keplerian orbital elements. These constants define the shape of an ellipse or hyperbola, orient it around its central body, and define the position of a satellite on the orbit. The classical orbital elements are:
- \(a\): semi-major axis, gives the size of the orbit
- \(e\): eccentricity, gives the shape of the orbit
- \(i\): inclination angle, gives the angle of the orbit plane to the central body’s equator
- \(\Omega\): Right ascension of the ascending node, which gives the rotation of the orbit plane from reference axis
- \(\omega\): Argument of periapsis is the angle from the ascending node to the periapsis point, measured along the orbit in the direction of the satellite’s motion
- \(\Theta\): True anomaly gives the location of the satellite on the orbit
The choice of six elements is not unique
For running the codes on this page, you’ll need the latest version of python installed on your system along with the required libraries which can be installed using the following command:
pip3 install numpy scipy plotly
Semi-major Axis (\(a\))
The semi-major axis determines the size of the conic section. For a circle, it is the radius, while for an ellipse, it describes the width of the ellipse. For a hyperbola, the semi-major axis describes the distance from the origin of the Cartesian coordinate system.
The semi-latus rectum may also be specifies instead of the semi-major axis, since with \(a\) and \(e\), \(p\) can be calculated. This is convenient for parabolic trajectories where the semi-major axis is not as meaningful.
Eccentricity (\(e\))
The eccentricity describes the deviation of the trajectory from a circle. When \(e = 0\), the orbit is circular; for values of \(e \lt 1\), the orbit is elliptical. When \(e = 1\), the orbit is parabolic, and for \(e \gt 1\), the orbit is hyperbolic.
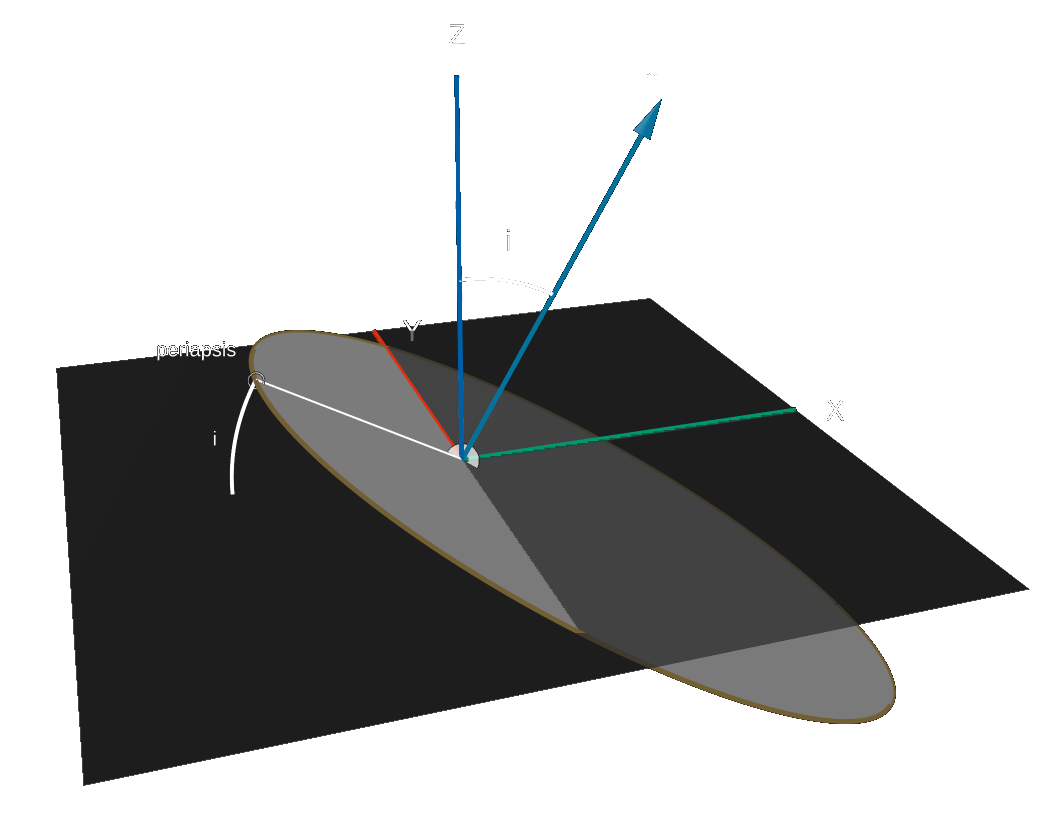
Inclination Angle (\(i\))
The inclination is the angle that the orbital plane makes with the plane of reference. Alternatively, it can also be defined as the angle between the normal to the plane of reference and the angular momentum vector (\(h\)).
An inclination of 0 degrees is an equatorial orbit. Orbits with inclinations are called prograde orbits because they rotate counter-clockwise when viewed from above the north pole. This is the same direction as the sirface of the Earth rotates and the same direction that planets orbit around the sub (except Venus).
An orbit with an inclination of 90 degrees is called a polar orbit because it passes directly over the north and south poles of the primary object.
Orbits from 90 degrees to 180 degrees are called retrograde orbits because they rotate clockwise when viewed from above the north pole. This is the opposite direction to the surface of Earth or the planets.
Plotting it yourself
In [1]:
import plotly.graph_objects as go
import numpy as np
from scipy.spatial.transform import Rotation as R
In [2]:
def arrow(start, end, fig=None, **kwargs):
    start_offset = kwargs.get("start_offset") or 0.98
    tip_ratio = kwargs.get("tip_ratio") or 0.1
    x_0, y_0, z_0 = start + start_offset * (end - start)
    u_0, v_0, w_0 = tip_ratio * (end - start)
    cone = go.Cone(
        x=[x_0],
        y=[y_0],
        z=[z_0],
        u=[u_0],
        v=[v_0],
        w=[w_0],
        showlegend=False,
        showscale=False,
        sizemode="absolute",
        sizeref=10,
        **kwargs.get("cone", {}),
    )
    coords = np.vstack((start, end))
    line = go.Scatter3d(
        x=coords[:, 0],
        y=coords[:, 1],
        z=coords[:, 2],
        mode="lines+text",
        line=kwargs.get("line"),
        text=["", "h"],
        textfont=dict(size=30, family="sans-serif", color="black"),
        textposition="top center",
    )
    if fig is not None:
        fig.add_trace(line)
        fig.add_trace(cone)
    else:
        return line, cone
In [3]:
colors = dict(
    green="rgb(102,194,165)",
    red="rgb(252,141,98)",
    blue="rgb(141,160,203)",
    pink="rgb(231,138,195)",
    lime="rgb(166,216,84)",
    yellow="rgb(255,217,47)",
)
In [4]:
a = 100
e = 0.4
b = a * np.sqrt(1 - e ** 2)
r_p = a * (1 - e)

inclination = 30
raan = 0
omega = 0

rot = R.from_euler("zxy", [0, 0, inclination], degrees=True)

theta = np.arange(0, 2 * np.pi, step=0.01)
phi = 0
r = a * (1 - e ** 2) / (1 - e * np.cos(theta - phi))
x = r * np.cos(theta)
y = r * np.sin(theta)
z = np.zeros_like(x)
r = np.vstack((x, y, z)).T
rotated = rot.apply(r)

vector_scale = 100
h_vec = np.zeros((2, 3), dtype=float)
h_vec[1, 2] = vector_scale
rot_vec = rot.apply(h_vec)

periapsis = np.array(((0, 0, 0), (-r_p, 0, 0)))
peri_rot = rot.apply(periapsis)

plane_size = 100
plane = np.array(
    (
        (-plane_size, -plane_size, 0),
        (-plane_size, plane_size, 0),
        (plane_size, -plane_size, 0),
        (plane_size, plane_size, 0),
    )
)
inclination_range = np.arange(0, np.radians(inclination), step=0.01)
arc = (
    vector_scale
    / 2
    * np.vstack(
        (
            np.sin(inclination_range),
            np.zeros_like(inclination_range),
            np.cos(inclination_range),
        )
    ).T
)
arc_2 = (
    -r_p
    * np.vstack(
        (
            np.cos(inclination_range),
            np.zeros_like(inclination_range),
            -np.sin(inclination_range),
        )
    ).T
)
In [5]:
data = go.Scatter3d(
    x=rotated[:, 0],
    y=rotated[:, 1],
    z=rotated[:, 2],
    mode="lines",
    line=dict(color=colors["blue"], width=10),
)
d2 = go.Mesh3d(
    x=rotated[:, 0], y=rotated[:, 1], z=rotated[:, 2], color="gray", opacity=1.0
)

d3 = go.Mesh3d(
    x=plane[:, 0], y=plane[:, 1], z=plane[:, 2], opacity=0.7, color="lightgray"
)

d4 = go.Scatter3d(
    x=[0],
    y=[0],
    z=[0],
    mode="markers",
    marker=dict(color="black", size=[40], sizeref=1, sizemode="diameter"),
    text="m1",
    textfont=dict(size=30, family="sans-serif", color="black"),
    textposition="top right",
)
d5 = go.Scatter3d(
    x=[0, 0],
    y=[0, 0],
    z=[0, 100],
    mode="lines+text",
    line={"width": 10},
    text=["", "Z"],
    textfont=dict(size=30, family="sans-serif", color="black"),
    textposition="top center",
)
d6 = go.Scatter3d(
    x=[0, 0],
    y=[0, 100],
    z=[0, 0],
    mode="lines+text",
    line={"width": 10},
    text=["", "Y"],
    textfont=dict(size=30, family="sans-serif", color="black"),
    textposition="middle right",
)
d7 = go.Scatter3d(
    x=[0, 100],
    y=[0, 0],
    z=[0, 0],
    mode="lines+text",
    line={"width": 10},
    text=["", "X"],
    textfont=dict(size=30, family="sans-serif", color="black"),
    textposition="middle right",
)

mid = arc.shape[0] // 2
label = [""] * arc.shape[0]
label[mid] = "i"
arcline = go.Scatter3d(
    x=arc[:, 0],
    y=arc[:, 1],
    z=arc[:, 2],
    mode="lines+text",
    line={"width": 8, "color": "black"},
    text=label,
    textfont=dict(size=30, family="sans-serif", color="black"),
    textposition="top center",
)

arcline_2 = go.Scatter3d(
    x=arc_2[:, 0],
    y=arc_2[:, 1],
    z=arc_2[:, 2],
    mode="lines+text",
    line={"width": 8, "color": "black"},
    text=label,
    textfont=dict(size=20, family="sans-serif", color="black"),
    textposition="middle left",
)

periline = go.Scatter3d(
    x=peri_rot[:, 0],
    y=peri_rot[:, 1],
    z=peri_rot[:, 2],
    mode="lines+markers+text",
    line={"width": 8, "color": "black"},
    marker={"symbol": "circle-open", "size": [0, 20]},
    text=["", "periapsis"],
    textfont=dict(size=20, family="sans-serif", color="black"),
    textposition="top left",
)

layout = dict(
    width=1080,
    height=720,
    autosize=False,
    xaxis={
        "showgrid": False,  # thin lines in the background
        "zeroline": False,  # thick line at x=0
        "visible": False,  # numbers below
    },
    yaxis={
        "showgrid": False,  # thin lines in the background
        "zeroline": False,  # thick line at x=0
        "visible": False,  # numbers below
    },
    scene=dict(
        hovermode=False,
        camera=dict(
            up=dict(
                x=0,
                y=0,
                z=1,
            ),
            eye=dict(
                x=1.0707,
                y=-1.0707,
                z=1,
            ),
        ),
        # aspectratio = dict( x=1, y=1, z=0.7 ),
        aspectmode="manual",
        xaxis={"showgrid": False, "zeroline": False, "visible": False},
        yaxis={"showgrid": False, "zeroline": False, "visible": False},
        zaxis={"showgrid": False, "zeroline": False, "visible": False},
    ),
    showlegend=False,
    margin={"b": 0, "t": 0, "r": 0, "l": 0},
)
In [6]:
fig = go.Figure(layout=layout)

fig.add_trace(data)
fig.add_trace(d2)
fig.add_trace(d3)
fig.add_trace(d4)
fig.add_trace(d5)
fig.add_trace(d6)
fig.add_trace(d7)
arrow(
    start=rot_vec[0, :],
    end=rot_vec[1, :],
    fig=fig,
    line={"width": 10.0, "color": colors["red"]},
    cone={"colorscale": [[0, colors["red"]], [1, colors["red"]]]},
)
fig.add_trace(arcline)
fig.add_trace(arcline_2)
fig.add_trace(periline)

fig.show()
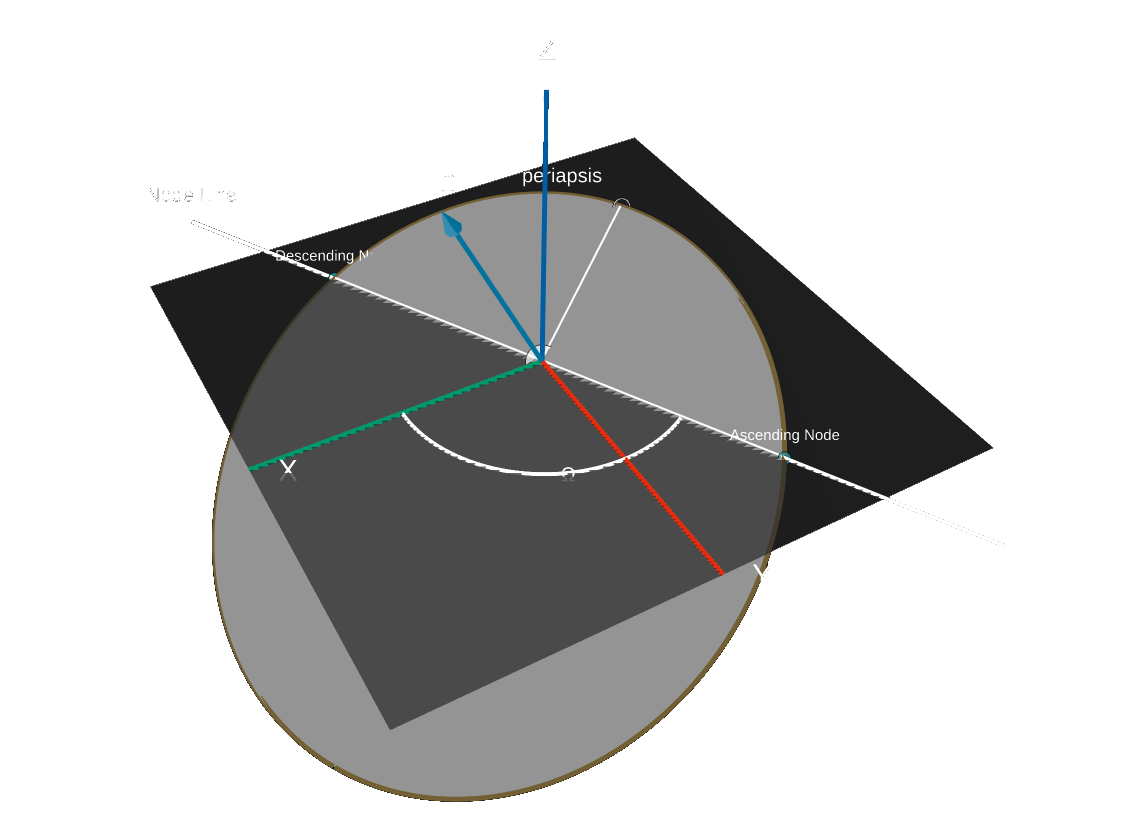
Right Ascension of the Ascending Node (\(\Omega\))
Consider an orbit as shown in the following figure. The spacecraft spends part of its time above the reference plane and part of the time below the reference plane.
Plotting it yourself
In [1]:
import plotly.graph_objects as go
import numpy as np
from scipy.spatial.transform import Rotation as R
In [2]:
def arrow(start, end, fig=None, **kwargs):
    start_offset = kwargs.get("start_offset") or 0.98
    tip_ratio = kwargs.get("tip_ratio") or 0.1
    x_0, y_0, z_0 = start + start_offset * (end - start)
    u_0, v_0, w_0 = tip_ratio * (end - start)
    cone = go.Cone(
        x=[x_0],
        y=[y_0],
        z=[z_0],
        u=[u_0],
        v=[v_0],
        w=[w_0],
        showlegend=False,
        showscale=False,
        sizemode="absolute",
        sizeref=10,
        **kwargs.get("cone", {}),
    )
    coords = np.vstack((start, end))
    line = go.Scatter3d(
        x=coords[:, 0],
        y=coords[:, 1],
        z=coords[:, 2],
        mode="lines+text",
        line=kwargs.get("line"),
        text=["", "h"],
        textfont=dict(size=30, family="sans-serif", color="black"),
        textposition="top center",
    )
    if fig is not None:
        fig.add_trace(line)
        fig.add_trace(cone)
    else:
        return line, cone
In [3]:
colors = dict(
    green="rgb(102,194,165)",
    red="rgb(252,141,98)",
    blue="rgb(141,160,203)",
    pink="rgb(231,138,195)",
    lime="rgb(166,216,84)",
    yellow="rgb(255,217,47)",
)
In [4]:
a = 100
e = 0.4
b = a * np.sqrt(1 - e ** 2)
r_p = a * (1 - e)
p = a * (1 - e ** 2)

inclination = 30
raan = 30
omega = 0

rot = R.from_euler("ZY", [raan, inclination], degrees=True)

theta = np.arange(0, 2 * np.pi, step=0.01)
phi = 0

r = a * (1 - e ** 2) / (1 - e * np.cos(theta - phi))
x = r * np.cos(theta)
y = r * np.sin(theta)
z = np.zeros_like(x)
r = np.vstack((x, y, z)).T
rotated = rot.apply(r)

vector_scale = 100
h_vec = np.zeros((2, 3), dtype=float)
h_vec[1, 2] = vector_scale
rot_vec = rot.apply(h_vec)

periapsis = np.array(((0, 0, 0), (-r_p, 0, 0)))
peri_rot = rot.apply(periapsis)

plane_size = 100
plane = np.array(
    (
        (-plane_size, -plane_size, 0),
        (-plane_size, plane_size, 0),
        (plane_size, -plane_size, 0),
        (plane_size, plane_size, 0),
    )
)
inclination_range = np.arange(0, np.radians(inclination), step=0.01)
arc = (
    vector_scale
    / 2
    * np.vstack(
        (
            np.sin(inclination_range),
            np.zeros_like(inclination_range),
            np.cos(inclination_range),
        )
    ).T
)
arc_rot = R.from_euler("Z", [raan], degrees=True)
arc = arc_rot.apply(arc)
arc_2 = (
    -r_p
    * np.vstack(
        (
            np.cos(inclination_range),
            np.zeros_like(inclination_range),
            -np.sin(inclination_range),
        )
    ).T
)
arc_2 = arc_rot.apply(arc_2)
N_vec = np.cross([0, 0, 1], rot_vec[1, :])
N = np.linalg.norm(N_vec)
u_N = N_vec / N
node_line = np.vstack(
    (
        np.linspace(-75, 75, 2),
        u_N[1] / u_N[0] * np.linspace(-75, 75, 2),
        np.zeros(2),
    )
).T

nodes = np.array(((0, p, 0), (0, -p, 0)))
nodes = rot.apply(nodes)

raan_range = np.arange(0, np.radians(90 + raan), step=0.01)
raan_arc = (
    vector_scale
    / 2
    * np.vstack((np.cos(raan_range), np.sin(raan_range), np.zeros_like(raan_range))).T
)
In [5]:
data = go.Scatter3d(
    x=rotated[:, 0],
    y=rotated[:, 1],
    z=rotated[:, 2],
    mode="lines",
    line=dict(color=colors["blue"], width=10),
)
d2 = go.Mesh3d(
    x=rotated[:, 0], y=rotated[:, 1], z=rotated[:, 2], color="gray", opacity=1.0
)

d3 = go.Mesh3d(
    x=plane[:, 0], y=plane[:, 1], z=plane[:, 2], opacity=0.7, color="lightgray"
)

d4 = go.Scatter3d(
    x=[0],
    y=[0],
    z=[0],
    mode="markers",
    marker=dict(color="black", size=[40], sizeref=1, sizemode="diameter"),
    text="m1",
    textfont=dict(size=30, family="sans-serif", color="black"),
    textposition="top right",
)
d5 = go.Scatter3d(
    x=[0, 0],
    y=[0, 0],
    z=[0, 100],
    mode="lines+text",
    line={"width": 10},
    text=["", "Z"],
    textfont=dict(size=30, family="sans-serif", color="black"),
    textposition="top center",
)
d6 = go.Scatter3d(
    x=[0, 0],
    y=[0, 100],
    z=[0, 0],
    mode="lines+text",
    line={"width": 10},
    text=["", "Y"],
    textfont=dict(size=30, family="sans-serif", color="black"),
    textposition="middle right",
)
d7 = go.Scatter3d(
    x=[0, 100],
    y=[0, 0],
    z=[0, 0],
    mode="lines+text",
    line={"width": 10},
    text=["", "X"],
    textfont=dict(size=30, family="sans-serif", color="black"),
    textposition="middle right",
)

mid = arc.shape[0] // 2
label = [""] * arc.shape[0]
label[mid] = "i"
arcline = go.Scatter3d(
    x=arc[:, 0],
    y=arc[:, 1],
    z=arc[:, 2],
    mode="lines+text",
    line={"width": 8, "color": "black"},
    text=label,
    textfont=dict(size=30, family="sans-serif", color="black"),
    textposition="top center",
)

arcline_2 = go.Scatter3d(
    x=arc_2[:, 0],
    y=arc_2[:, 1],
    z=arc_2[:, 2],
    mode="lines+text",
    line={"width": 8, "color": "black"},
    text=label,
    textfont=dict(size=20, family="sans-serif", color="black"),
    textposition="middle left",
)

periline = go.Scatter3d(
    x=peri_rot[:, 0],
    y=peri_rot[:, 1],
    z=peri_rot[:, 2],
    mode="lines+markers+text",
    line={"width": 8, "color": "black"},
    marker={"symbol": "circle-open", "size": [0, 20]},
    text=["", "periapsis"],
    textfont=dict(size=20, family="sans-serif", color="black"),
    textposition="top left",
)

nodeline = go.Scatter3d(
    x=node_line[:, 0],
    y=node_line[:, 1],
    z=node_line[:, 2],
    mode="lines+text",
    line={"width": 8, "color": "black"},
    text=["", "Node Line"],
    textfont=dict(size=20, family="sans-serif", color="black"),
    textposition="top center",
)

nodesmarks = go.Scatter3d(
    x=nodes[:, 0],
    y=nodes[:, 1],
    z=nodes[:, 2],
    mode="markers+text",
    marker={"size": [15, 15]},
    text=["Ascending Node", "Descending Node"],
    textfont=dict(size=15, family="sans-serif", color="black"),
    textposition="top center",
)
mid = raan_arc.shape[0] // 2
label = [""] * raan_arc.shape[0]
label[mid] = "Ω"
raanarc = go.Scatter3d(
    x=raan_arc[:, 0],
    y=raan_arc[:, 1],
    z=raan_arc[:, 2],
    mode="lines+text",
    line={"width": 8, "color": "black"},
    text=label,
    textfont=dict(size=20, family="sans-serif", color="black"),
    textposition="middle right",
)

layout = dict(
    width=1080,
    height=720,
    autosize=False,
    xaxis={
        "showgrid": False,  # thin lines in the background
        "zeroline": False,  # thick line at x=0
        "visible": False,  # numbers below
    },
    yaxis={
        "showgrid": False,  # thin lines in the background
        "zeroline": False,  # thick line at x=0
        "visible": False,  # numbers below
    },
    scene=dict(
        hovermode=False,
        camera=dict(
            up=dict(
                x=0,
                y=0,
                z=1,
            ),
            eye=dict(
                x=1.0707,
                y=-1.0707,
                z=1,
            ),
        ),
        aspectmode="manual",
        xaxis={"showgrid": False, "zeroline": False, "visible": False},
        yaxis={"showgrid": False, "zeroline": False, "visible": False},
        zaxis={"showgrid": False, "zeroline": False, "visible": False},
    ),
    showlegend=False,
    margin={"b": 0, "t": 0, "r": 0, "l": 0},
)
In [6]:
fig = go.Figure(layout=layout)

fig.add_trace(data)
fig.add_trace(d2)
fig.add_trace(d3)
fig.add_trace(d4)
fig.add_trace(d5)
fig.add_trace(d6)
fig.add_trace(d7)
arrow(
    start=rot_vec[0, :],
    end=rot_vec[1, :],
    fig=fig,
    line={"width": 10.0, "color": colors["red"]},
    cone={"colorscale": [[0, colors["red"]], [1, colors["red"]]]},
)

fig.add_trace(periline)
fig.add_trace(nodeline)
fig.add_trace(nodesmarks)
fig.add_trace(raanarc)

fig.show()
The intersection of these two planes is a line, called the node line. This line will appear in calculations later. Since the orbit follows the perimeter of tthe orbital plane, this implies there are two crossing points:
- The dedscending node: The point when the spacecraft goes from above to below the reference plane
- The ascending node: The point when the spacecraft goes from below to above the reference plane
The right ascension of the ascending node (RAAN) is defined as the right ascension of the point where the spacecraft goes from below the reference plane to above it.
The right ascension of the ascending node can range from 0 to 360 degrees, inclusive.
Obviouslt, if the orbit has an inclination of 0 or 180 degrees, the right ascension of the ascending node is not defines. For these inclinations, the orbit is coplanar with the reference plane, and does not go above or below it.
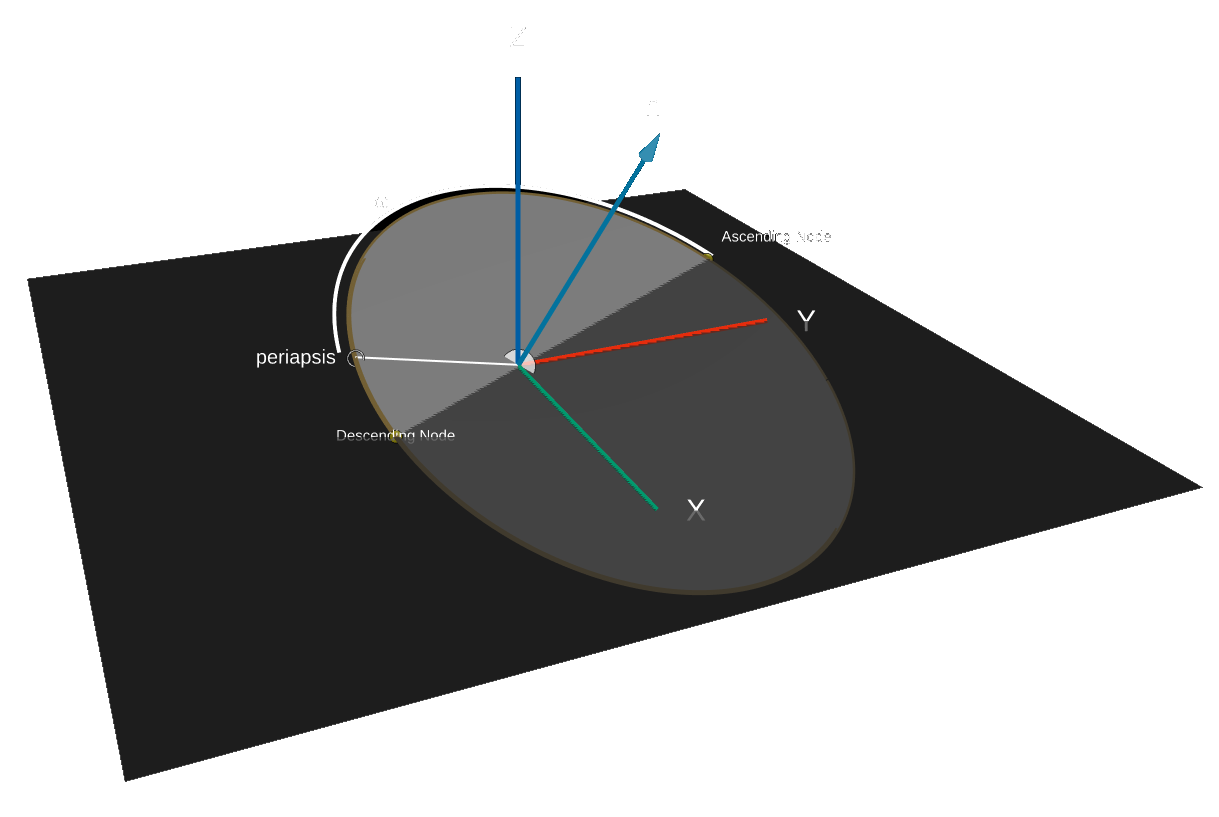
Argument of Periapsis (\(\omega\))
In perifocal reference frame, periapsis occurs at true anomaly of 0 degrees. The argument of periapsis determines how far around the orbit you have to go, starting at the ascending node, before you get to periapsis.
Plotting it yourself
In [1]:
import plotly.graph_objects as go
import numpy as np
from scipy.spatial.transform import Rotation as R
In [2]:
def arrow(start, end, fig=None, **kwargs):
    start_offset = kwargs.get("start_offset") or 0.98
    tip_ratio = kwargs.get("tip_ratio") or 0.1
    x_0, y_0, z_0 = start + start_offset * (end - start)
    u_0, v_0, w_0 = tip_ratio * (end - start)
    cone = go.Cone(
        x=[x_0],
        y=[y_0],
        z=[z_0],
        u=[u_0],
        v=[v_0],
        w=[w_0],
        showlegend=False,
        showscale=False,
        sizemode="absolute",
        sizeref=10,
        **kwargs.get("cone", {}),
    )
    coords = np.vstack((start, end))
    line = go.Scatter3d(
        x=coords[:, 0],
        y=coords[:, 1],
        z=coords[:, 2],
        mode="lines+text",
        line=kwargs.get("line"),
        text=["", "h"],
        textfont=dict(size=30, family="sans-serif", color="black"),
        textposition="top center",
    )
    if fig is not None:
        fig.add_trace(line)
        fig.add_trace(cone)
    else:
        return line, cone
In [3]:
colors = dict(
    green="rgb(102,194,165)",
    red="rgb(252,141,98)",
    blue="rgb(141,160,203)",
    pink="rgb(231,138,195)",
    lime="rgb(166,216,84)",
    yellow="rgb(255,217,47)",
)
In [4]:
a = 100
e = 0.4
b = a * np.sqrt(1 - e ** 2)
r_p = a * (1 - e)
p = a * (1 - e ** 2)

inclination = 30
raan = 30
omega = 60

rot = R.from_euler("ZYZ", [raan, inclination, omega], degrees=True)

theta = np.arange(0, 2 * np.pi, step=0.01)
phi = 0

r = a * (1 - e ** 2) / (1 - e * np.cos(theta - phi))
x = r * np.cos(theta)
y = r * np.sin(theta)
z = np.zeros_like(x)
r = np.vstack((x, y, z)).T
rotated = rot.apply(r)

vector_scale = 100
h_vec = np.zeros((2, 3), dtype=float)
h_vec[1, 2] = vector_scale
rot_vec = rot.apply(h_vec)

periapsis = np.array(((0, 0, 0), (-r_p, 0, 0)))
peri_rot = rot.apply(periapsis)

plane_size = 150
plane = np.array(
    (
        (-plane_size, -plane_size, 0),
        (-plane_size, plane_size, 0),
        (plane_size, -plane_size, 0),
        (plane_size, plane_size, 0),
    )
)
inclination_range = np.arange(0, np.radians(inclination), step=0.01)
arc = (
    vector_scale
    / 2
    * np.vstack(
        (
            np.sin(inclination_range),
            np.zeros_like(inclination_range),
            np.cos(inclination_range),
        )
    ).T
)
arc_rot = R.from_euler("Z", [raan], degrees=True)
arc = arc_rot.apply(arc)
arc_2 = (
    -r_p
    * np.vstack(
        (
            np.cos(inclination_range),
            np.zeros_like(inclination_range),
            -np.sin(inclination_range),
        )
    ).T
)
arc_2 = arc_rot.apply(arc_2)
N_vec = np.cross([0, 0, 1], rot_vec[1, :])
N = np.linalg.norm(N_vec)
u_N = N_vec / N
node_line = np.vstack(
    (
        np.linspace(-100, 100, 2),
        u_N[1] / u_N[0] * np.linspace(-100, 100, 2),
        np.zeros(2),
    )
).T

ascending_node = rotated[52]
descending_node = rotated[367]
nodes = np.vstack((ascending_node, descending_node))

raan_range = np.arange(0, np.radians(90 + raan), step=0.01)
raan_arc = (
    vector_scale
    / 2
    * np.vstack((np.cos(raan_range), np.sin(raan_range), np.zeros_like(raan_range))).T
)

r_rot = np.linalg.norm(rotated, axis=1) + 5
t_rot = np.arctan2(np.linalg.norm(rotated[:, :2], axis=1), rotated[:, 2])
p_rot = np.arctan2(rotated[:, 1], rotated[:, 0])
x_new = r_rot * np.cos(p_rot) * np.sin(t_rot)
y_new = r_rot * np.sin(p_rot) * np.sin(t_rot)
z_new = r_rot * np.cos(t_rot)
In [5]:
data = go.Scatter3d(
    x=rotated[:, 0],
    y=rotated[:, 1],
    z=rotated[:, 2],
    mode="lines",
    line=dict(color=colors["blue"], width=10),
)
d2 = go.Mesh3d(
    x=rotated[:, 0], y=rotated[:, 1], z=rotated[:, 2], color="gray", opacity=1.0
)

d3 = go.Mesh3d(
    x=plane[:, 0], y=plane[:, 1], z=plane[:, 2], opacity=0.7, color="lightgray"
)

d4 = go.Scatter3d(
    x=[0],
    y=[0],
    z=[0],
    mode="markers",
    marker=dict(color="black", size=[40], sizeref=1, sizemode="diameter"),
    text="m1",
    textfont=dict(size=30, family="sans-serif", color="black"),
    textposition="top right",
)
d5 = go.Scatter3d(
    x=[0, 0],
    y=[0, 0],
    z=[0, 100],
    mode="lines+text",
    line={"width": 10},
    text=["", "Z"],
    textfont=dict(size=30, family="sans-serif", color="black"),
    textposition="top center",
)
d6 = go.Scatter3d(
    x=[0, 0],
    y=[0, 100],
    z=[0, 0],
    mode="lines+text",
    line={"width": 10},
    text=["", "Y"],
    textfont=dict(size=30, family="sans-serif", color="black"),
    textposition="middle right",
)
d7 = go.Scatter3d(
    x=[0, 100],
    y=[0, 0],
    z=[0, 0],
    mode="lines+text",
    line={"width": 10},
    text=["", "X"],
    textfont=dict(size=30, family="sans-serif", color="black"),
    textposition="middle right",
)

mid = arc.shape[0] // 2
label = [""] * arc.shape[0]
label[mid] = "i"
arcline = go.Scatter3d(
    x=arc[:, 0],
    y=arc[:, 1],
    z=arc[:, 2],
    mode="lines+text",
    line={"width": 8, "color": "black"},
    text=label,
    textfont=dict(size=30, family="sans-serif", color="black"),
    textposition="top center",
)

arcline_2 = go.Scatter3d(
    x=arc_2[:, 0],
    y=arc_2[:, 1],
    z=arc_2[:, 2],
    mode="lines+text",
    line={"width": 8, "color": "black"},
    text=label,
    textfont=dict(size=20, family="sans-serif", color="black"),
    textposition="middle left",
)

periline = go.Scatter3d(
    x=peri_rot[:, 0],
    y=peri_rot[:, 1],
    z=peri_rot[:, 2],
    mode="lines+markers+text",
    line={"width": 8, "color": "black"},
    marker={"symbol": "circle-open", "size": [0, 20]},
    text=["", "periapsis"],
    textfont=dict(size=20, family="sans-serif", color="black"),
    textposition="middle left",
)

nodeline = go.Scatter3d(
    x=node_line[:, 0],
    y=node_line[:, 1],
    z=node_line[:, 2],
    mode="lines+text",
    line={"width": 8, "color": "black"},
    text=["", "Node Line"],
    textfont=dict(size=20, family="sans-serif", color="black"),
    textposition="top center",
)

nodesmarks = go.Scatter3d(
    x=nodes[:, 0],
    y=nodes[:, 1],
    z=nodes[:, 2],
    mode="markers+text",
    marker={"size": [15, 15]},
    text=["Ascending Node", "Descending Node"],
    textfont=dict(size=15, family="sans-serif", color="black"),
    textposition=["middle right", "middle left"],
)
mid = raan_arc.shape[0] // 2
label = [""] * raan_arc.shape[0]
label[mid] = "Ω"
raanarc = go.Scatter3d(
    x=raan_arc[:, 0],
    y=raan_arc[:, 1],
    z=raan_arc[:, 2],
    mode="lines+text",
    line={"width": 8, "color": "black"},
    text=label,
    textfont=dict(size=20, family="sans-serif", color="black"),
    textposition="middle right",
)

mid = x_new[52:312].shape[0] // 2
label = [""] * x_new[52:312].shape[0]
label[mid] = "ω"
omegaarc = go.Scatter3d(
    x=x_new[52:312],
    y=y_new[52:312],
    z=z_new[52:312],
    mode="lines+text",
    line={"width": 8, "color": "black"},
    text=label,
    textfont=dict(size=20, family="sans-serif", color="black"),
    textposition="middle left",
)

layout = dict(
    width=1920,
    height=1080,
    autosize=False,
    xaxis={
        "showgrid": False,  # thin lines in the background
        "zeroline": False,  # thick line at x=0
        "visible": False,  # numbers below
    },
    yaxis={
        "showgrid": False,  # thin lines in the background
        "zeroline": False,  # thick line at x=0
        "visible": False,  # numbers below
    },
    scene=dict(
        hovermode=False,
        camera=dict(
            up=dict(
                x=0,
                y=0,
                z=1,
            ),
            eye=dict(
                x=1.0707,
                y=-1.0707,
                z=1,
            ),
        ),
        aspectmode="manual",
        xaxis={"showgrid": False, "zeroline": False, "visible": False},
        yaxis={"showgrid": False, "zeroline": False, "visible": False},
        zaxis={"showgrid": False, "zeroline": False, "visible": False},
    ),
    showlegend=False,
    margin={"b": 0, "t": 0, "r": 0, "l": 0},
)
In [6]:
fig = go.Figure(layout=layout)

fig.add_trace(data)
fig.add_trace(d2)
fig.add_trace(d3)
fig.add_trace(d4)
fig.add_trace(d5)
fig.add_trace(d6)
fig.add_trace(d7)
arrow(
    start=rot_vec[0, :],
    end=rot_vec[1, :],
    fig=fig,
    line={"width": 10.0, "color": colors["red"]},
    cone={"colorscale": [[0, colors["red"]], [1, colors["red"]]]},
)

fig.add_trace(periline)
fig.add_trace(nodesmarks)
fig.add_trace(omegaarc)

fig.show()
Alternatively, if you know the right ascension of periapsis (RAP or \(\varPi\)), you can calculate the argument of periapsis as:
\[\begin{equation} \varPi = \Omega + \omega \end{equation}\]If there is no periapsis, as in a circular orbit, then \(\varPi\) and \(\omega\), both are undedfined.
True Anomaly (\(\Theta\))
To get a better feel of what these orbital elements do and changing what changes what exactly in the orbit, you can try converting these orbital elements into ground based longitudes and latitudes.
In fact, that is exactly what has been done at Satellite Orbit Simulator by @Jadit19, @VasuP36 and @Rajarshi1001.